-
- Trading Platforms
- PU Prime App
- MetaTrader 5
- MetaTrader 4
- PU Copy Trading
- Web Trader
- PU Social
-
- Trading Conditions
- Account Types
- Spreads, Costs & Swaps
- Deposits & Withdrawals
- Fee & Charges
- Trading Hours

Key Takeaways:
*Wall Street ended mixed as the Dow fell 226 points (0.5%), while tech-heavy indices advanced amid subdued overall sentiment.
*A record $38 billion cloud partnership between Amazon Web Services and OpenAI sparked a sector-wide surge, sending Amazon shares up 3.8% to an all-time high.
*Traders await Wednesday’s ADP report as a key labor gauge amid a government data delay.
Market Summary:
Wall Street delivered a mixed performance in the last session, with a sharp sell-off in the Dow Jones Industrial Average contrasting with gains in tech-heavy indices. The Dow fell 226 points, or 0.5%, as overall market sentiment remained subdued, reflected in moderate trading volume of 10.8 billion shares, below the recent average.
The session’s standout move was fueled by a blockbuster strategic partnership announcement between Amazon Web Services and OpenAI, valued at an estimated $38 billion. The multi-year agreement, hailed as the largest cloud computing deal in history, spurred a wave of AI-driven optimism. This catalyzed a rally in the technology sector, lifting the Nasdaq Composite by 109 points and the S&P 500 by 11.84 points.
Amazon emerged as a key beneficiary, with its shares surging 3.8% to a record high of $212.45, extending its recent upward momentum.
Despite the positive sentiment from the tech sector, market volatility is expected to remain in focus as traders await Wednesday’s release of the ADP National Employment Report. With the U.S. government’s official jobs data delayed due to a shutdown, the ADP print will serve as the primary forward indicator of labor market performance. A softer-than-expected reading could bolster market speculation for a Federal Reserve rate cut as early as December, potentially lifting equity sentiment, while a strong figure may reinforce a “higher-for-longer” rates narrative.
Technical Analysis

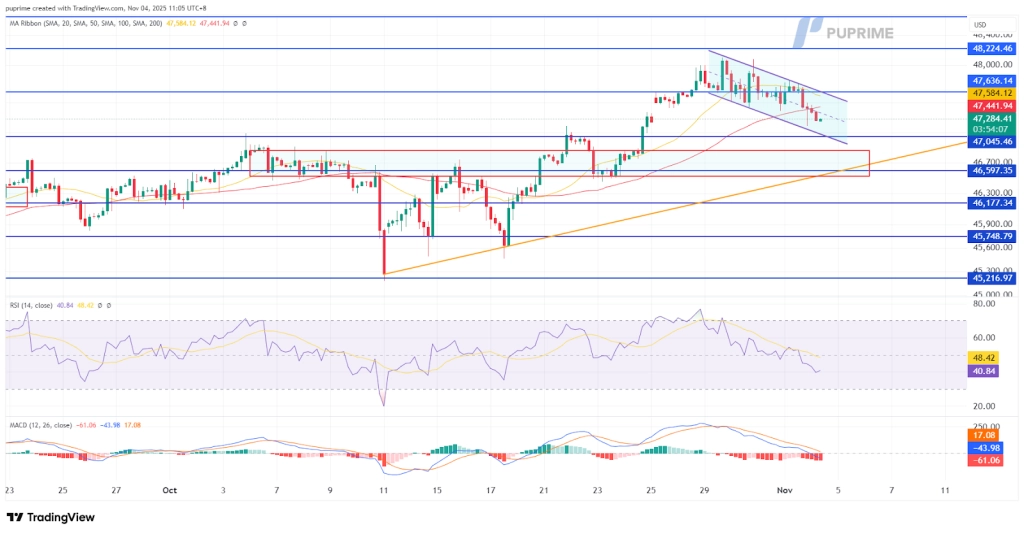
The Dow Jones Industrial Average has established a pronounced bearish near-term trajectory, characterized by a consistent series of lower highs and lower lows, forming a clear downtrend channel following its retreat from the all-time high of 48,098. This price action signifies a distinct distribution phase and a shift in market sentiment.
Technically, the index is approaching a critical liquidity zone near the 46,700 level. A further slide could trigger a liquidity grab in this region, which often acts as a catalyst for a short-term technical rebound as sellers exhaust and dip-buyers emerge.
Momentum indicators confirm the prevailing selling pressure. The Relative Strength Index (RSI) has not only declined but has breached the 50 mid-line, indicating strengthening bearish momentum. Simultaneously, the Moving Average Convergence Divergence (MACD) is on the verge of a bearish crossover below its zero line. This alignment of both oscillators underscores a solidly negative near-term bias for the index, suggesting any rebound is likely to be corrective within a broader downtrend unless key resistance levels are reclaimed.
Resistance Levels:47,640.00, 48,225.00
Support Levels: 47,050.00, 46,600.00

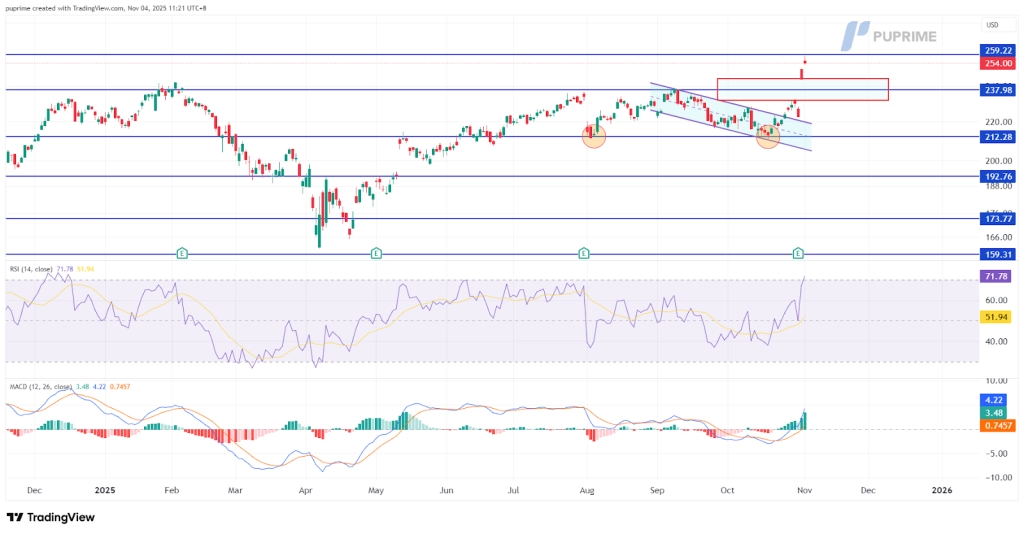
Amazon shares catalyzed a significant bullish breakout to start the week, gapping more than 10% higher. This move has established a new upward trajectory for the stock, though the pronounced price gap creates a near-term imbalance that may be filled before the next leg higher, offering a potential entry point for buyers.
The technical structure has turned decisively positive. The share price has formed a robust support base near the $212.28 level, evident in a double-bottom reversal pattern. This was followed by a decisive break above a key downtrend resistance line, confirming a bullish trend reversal and signaling a shift in market structure.
Momentum indicators support this constructive view. The Moving Average Convergence Divergence (MACD) has generated a bullish golden cross and is poised to cross above its zero line, indicating a return to positive momentum. The Relative Strength Index (RSI) is approaching overbought territory, which, while suggesting the potential for a short-term consolidation or pullback to alleviate overextension, primarily reflects the powerful underlying buying pressure.
Resistance Levels:260.14, 286.65
Support Levels: 238.10, 212.28

Trade forex, indices, metal, and more at industry-low spreads and lightning-fast execution.
Sign up for a PU Prime Live Account with our hassle-free process.
Effortlessly fund your account with a wide range of channels and accepted currencies.
Access hundreds of instruments under market-leading trading conditions.

Please note the Website is intended for individuals residing in jurisdictions where accessing the Website is permitted by law.
Please note that PU Prime and its affiliated entities are neither established nor operating in your home jurisdiction.
By clicking the "Acknowledge" button, you confirm that you are entering this website solely based on your initiative and not as a result of any specific marketing outreach. You wish to obtain information from this website which is provided on reverse solicitation in accordance with the laws of your home jurisdiction.
Thank You for Your Acknowledgement!
Ten en cuenta que el sitio web está destinado a personas que residen en jurisdicciones donde el acceso al sitio web está permitido por la ley.
Ten en cuenta que PU Prime y sus entidades afiliadas no están establecidas ni operan en tu jurisdicción de origen.
Al hacer clic en el botón "Aceptar", confirmas que estás ingresando a este sitio web por tu propia iniciativa y no como resultado de ningún esfuerzo de marketing específico. Deseas obtener información de este sitio web que se proporciona mediante solicitud inversa de acuerdo con las leyes de tu jurisdicción de origen.
Thank You for Your Acknowledgement!