-
- Trading Platforms
- PU Prime App
- MetaTrader 5
- MetaTrader 4
- PU Copy Trading
- Web Trader
- PU Social
-
- Trading Conditions
- Account Types
- Spreads, Costs & Swaps
- Deposits & Withdrawals
- Fee & Charges
- Trading Hours

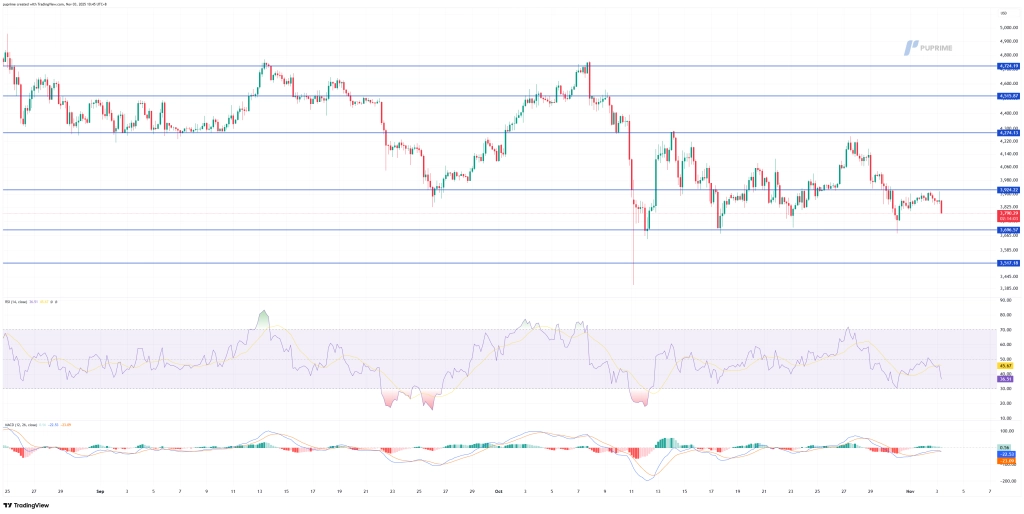
ETH, H4:
Ethereum (ETH/USD) continues to trade under bearish pressure after repeatedly failing to reclaim the $3,984–$4,073 resistance zone, with price now leaning back toward the key support area at $3,706–$3,760. The rejection from the October swing highs and the inability to sustain a higher-low structure suggest that bulls are losing momentum while sellers are gradually regaining control.
The broader structure has shifted into a corrective phase since the sharp liquidation spike on October 11, and the recovery that followed has so far shown limited follow-through. If price breaks below $3,695, followed by the major structural support at $3,520, which would mark a full retracement of the prior advance.
Momentum indicators lean cautious: the RSI has dipped to 36, indicating growing bearish bias but not yet oversold, while the MACD remains in negative territory with its histogram contracting slightly hinting at a possible slowdown in downside momentum. Overall, ETH’s near-term outlook remains bearish to neutral, with traders watching 3,790 as the key pivot level for directional cues.
Resistance Levels: 3925.00, 4275.00
Support Levels: 3695.00, 3520.00

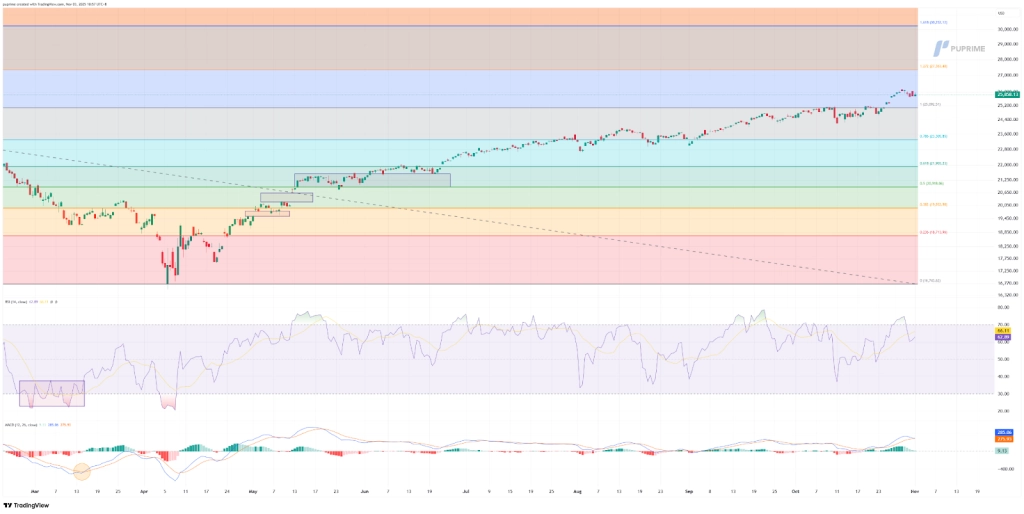
Nasdaq, H4
The Nasdaq 100 (NDX) has extended its upward trajectory, pushing beyond the 25,000 threshold and reaching the 25,880 region, its highest level since the mid-year consolidation. This advance confirms a strong continuation of the prevailing bullish structure, with price action now testing the 1.272 Fibonacci extension near 27,360, following a clean breakout above the prior 1.0 extension zone around 25,090.
The broader pattern shows a steady series of higher highs and higher lows, reflecting sustained buyer control. The breakout from the multi-week consolidation between 24,000 and 25,000 underscores renewed upward momentum and opens the door toward the next Fibonacci projection at 27,360, provided the index maintains traction above 25,000.
Momentum indicators remain constructive but suggest that bullish strength may be moderating. The RSI has retreated slightly from near-overbought territory, currently around 63, hinting at a potential short-term pause or consolidation. Meanwhile, the MACD remains in positive alignment above its signal line, with the histogram still supporting upward bias.
Resistance Levels: 27,360.00, 30,250.00
Support Levels:25,090.00, 23,305.00

Trade forex, indices, metal, and more at industry-low spreads and lightning-fast execution.
Sign up for a PU Prime Live Account with our hassle-free process.
Effortlessly fund your account with a wide range of channels and accepted currencies.
Access hundreds of instruments under market-leading trading conditions.

Please note the Website is intended for individuals residing in jurisdictions where accessing the Website is permitted by law.
Please note that PU Prime and its affiliated entities are neither established nor operating in your home jurisdiction.
By clicking the "Acknowledge" button, you confirm that you are entering this website solely based on your initiative and not as a result of any specific marketing outreach. You wish to obtain information from this website which is provided on reverse solicitation in accordance with the laws of your home jurisdiction.
Thank You for Your Acknowledgement!
Ten en cuenta que el sitio web está destinado a personas que residen en jurisdicciones donde el acceso al sitio web está permitido por la ley.
Ten en cuenta que PU Prime y sus entidades afiliadas no están establecidas ni operan en tu jurisdicción de origen.
Al hacer clic en el botón "Aceptar", confirmas que estás ingresando a este sitio web por tu propia iniciativa y no como resultado de ningún esfuerzo de marketing específico. Deseas obtener información de este sitio web que se proporciona mediante solicitud inversa de acuerdo con las leyes de tu jurisdicción de origen.
Thank You for Your Acknowledgement!